

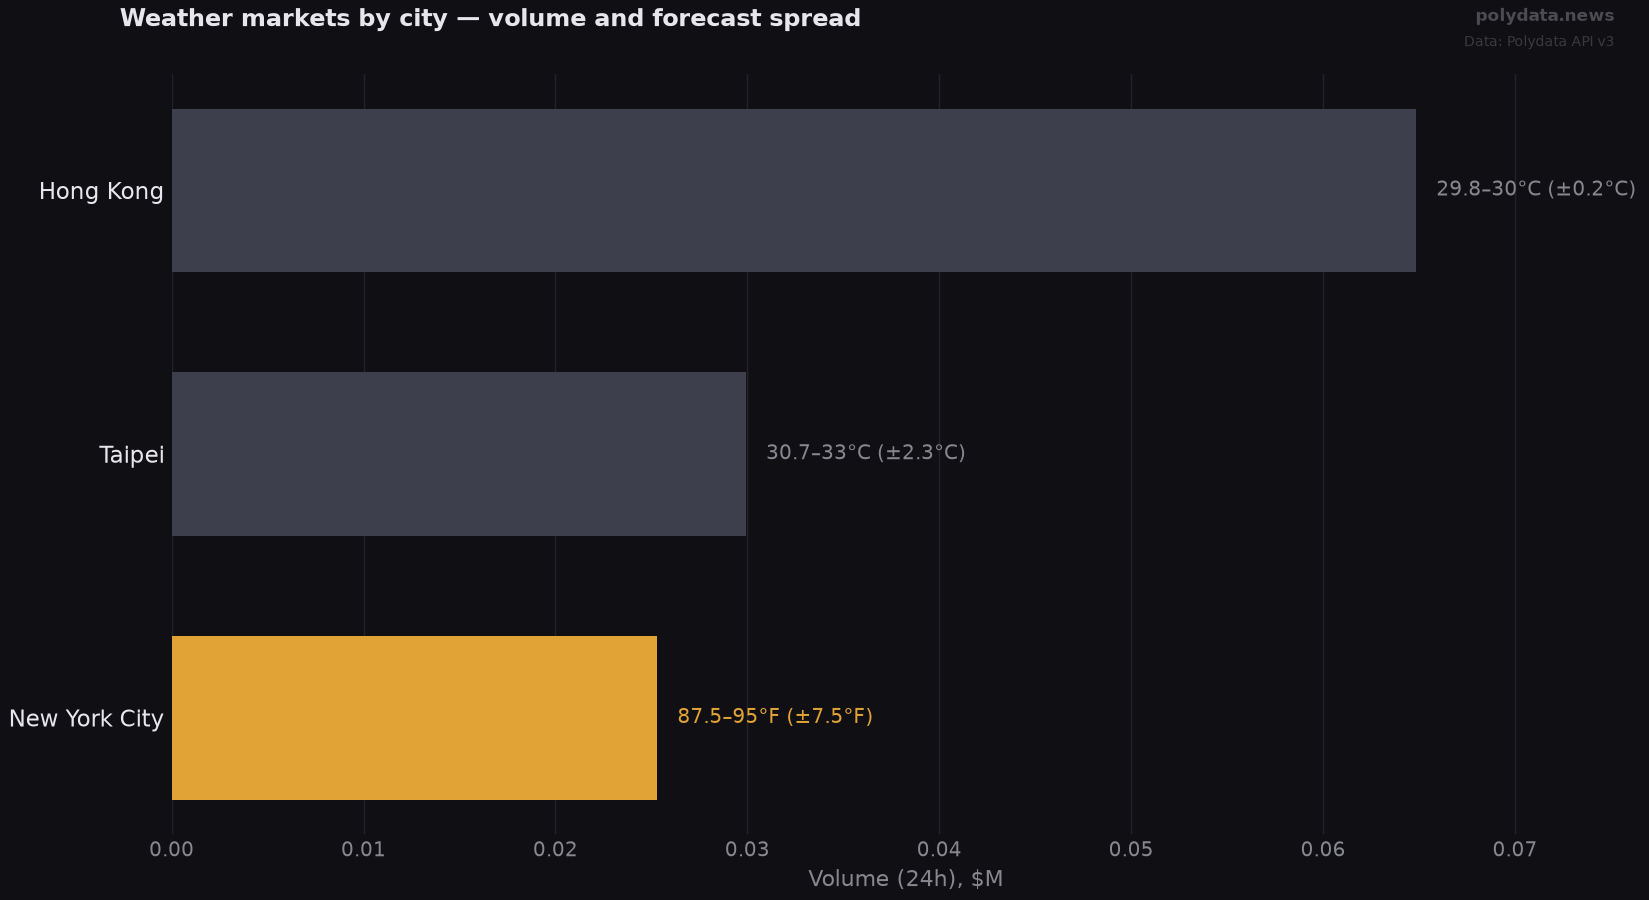
Weather prediction markets recorded $229K in trading volume over the past 24 hours across 52 active city markets. New York City exhibited the largest forecast divergence with a 7.5°F range in predicted highs, from 87.5°F to 95°F, generating $25K in market activity. This gap notably exceeds other cities, highlighting significant uncertainty among forecast sources.
Hong Kong posted the highest single-city volume at $65K, with a tight forecast spread of 0.2°C between 29.8°C and 30°C. The city’s all-time market depth stands at $713.51M, underscoring its continued dominance in liquidity. Taipei followed with $30K traded and a forecast range of 2.3°C between 30.7°C and 33°C.
Yesterday’s actual high in New York City was 88°F, close to the lower bound of today’s forecast range. Such disparities in model predictions create tradable opportunities by inviting speculation on which forecast will prove accurate. The broad 7.5°F spread in New York contrasts sharply with the narrow ranges in Hong Kong and Taipei, reflecting regional variations in forecast certainty and market engagement.
These figures demonstrate how forecast disagreement drives volume and market depth in weather prediction markets. The wide range in New York City’s temperature outlook signals ongoing uncertainty that traders are actively pricing, while Hong Kong’s liquidity dominance confirms its status as a key hub for weather market activity.
Today’s most active weather markets
| City | Volume (24h) | Forecast high | Spread |
|---|---|---|---|
| Hong Kong | $65K | 29.8°C–30°C | 0.2°C |
| Taipei | $30K | 30.7°C–33°C | 2.3°C |
| New York City | $25K | 87.5°F–95°F | 7.5°F |
Source: Polydata API v3 · /weather/cities · snapshot 2026-07-17. Data: Polydata API v3. On-chain figures are public. Realized PnL is computed over resolved markets only and excludes open positions, so it is conservative versus the Polymarket UI. This is not investment advice.